Being uninsured and unable to pay for treatment and medications can have a serious impact on one’s life. One such example is Gary, 55 years of age, who has COPD and experiences exacerbations that cause him to go to the ER. Upon discharge, he is unable to afford health services or medications to treat his condition. He lacks access to affordable care and continues to suffer from complications as his disease progresses. He is put in a difficult situation and chooses to ration medications so that he has enough money to afford basic needs like housing, food, and transportation. He is one of 14% of adults ages 18 to 64 that lack access to health insurance.1 For patients like Gary, programs like the Dispensary of Hope are essential to prevent disease progression, improve outcomes, and provide hope for a healthier future.
An uninsured individual does not have a program to assist covering high out of pocket healthcare expenses. Many of these patients are unable to afford proper healthcare treatment and often have to choose between prioritizing basic needs over medications. These patients are put in a difficult situation that often leaves them living with their diseases or complications until their health reaches a critical state. Lack of affordability is one of the main factors why individuals do not obtain healthcare services.
| Estimated Percentage of Uninsured in US by Age Group.1
January to June 2021 |
|
| Ages | Percent uninsured |
| 18-64 | 14% |
| <18 | 4.4% |
| 65+ | 0.6% |
In the United States, the majority of uninsured are 18-64 years of age. The entire US population has an uninsured rate of roughly 9.6% for the first half of 2021. Compared to 2020, these values have not changed significantly. 1,2
Affordability of healthcare insurance is a challenge especially for those with low income whose benefits are not provided by employer or government. According to the 2021 National Health Interview Survey, the prevalence of being uninsured was greatest among those with family incomes less than 200% compared to those with higher incomes. 1
| Estimated Percentage of Uninsured Adults Ages 18-64 by Federal Poverty Level1
January to June 2021 |
|
| Prevalence of uninsured out of all adults within FPL level: | |
| Family incomes less than 100% FPL | 26.9% were uninsured |
| Family incomes between 100%-200% FPL | 23.8% were uninsured |
| Family incomes greater than 200% FPL | 8.6% were uninsured |
There is also a strong difference in racial/ethnicity proportions for those that are uninsured. According to the 2021 National Health Interview Survey, we see that the largest racial/ethinic group that suffers the most from uninsured status are those of Hispanic origin. Approximately a third of the Hispanic population are uninsured, and this number far exceeds other races/ethnicity, with the second highest of non-Hispanic black at roughly 15% uninsured rate.1
With the ongoing COVID 19 pandemic, social disparities are further exacerbated for those of ethnicity. Not only is there a wide health coverage gap among these populations, there is difficulty in paying for basic needs. In April 2021, 64% of Black and 70% of Hispanic adults reported difficulty paying for household expenditures. Also, 7% Black and 12% Hispanic adults who report no confidence in paying next month’s housing payment. Even food availability can be sparse for some as 14% of Blacks and 16% of Hispanics report insufficient food supply in the house. 3 A person may have to chose between paying their bills, eat, and have a roof over their head, or going to the doctor and pharmacy to control their health conditions. These situations shape their behavior regarding their health.
| Percentage of Uninsured Adults Ages 18-64 by Race and Ethnicity1
January to June 2021 |
|
| Race/Ethnicity | Percent Uninsured |
| Hispanic | 31.4% |
| Non-Hispanic Black | 14.7% |
| Non-Hispanic White | 9.0% |
| Asian | 6.1% |
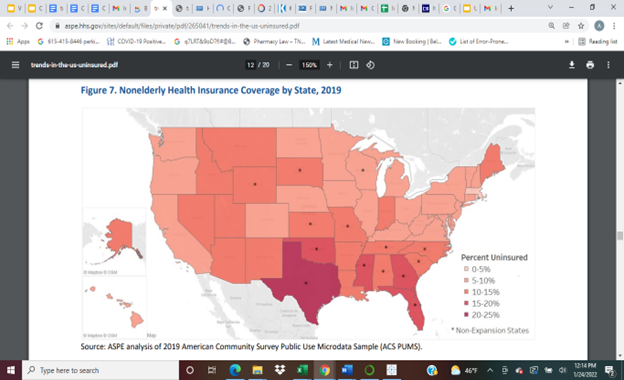
Geography and Medicaid expansion also impact the uninsured rate. As seen in Figure 1, most of the higher uninsured rates are attributed to those of southern and mountain states. Non-Medicaid expansion states tend to have higher uninsurance rates compared to other states.

Figure 1: Geographic heat map of uninsurance rate by state in 2019. 4
Knowing who the uninsured are can help guide targeting patients who may benefit from medications through a charitable pharmacy program. Those of Hispanic background constitute a good portion of these uninsured populations, so having within your facility a translation and interpreting services or having your documents and website cater to more than just English-speaking patients would help to make these patients feel more welcomed.
Ahmed Abogamiza, PharmD Candidate, 2022,
Belmont University College of Pharmacy
Adapted from Dispensary of Hope Newsletter
References
- Health Insurance Coverage: Early Release of Estimates From the National Health Interview Survey, January–June 2021. National center for health statistics. Released 11/2021. https://www.cdc.gov/nchs/data/nhis/earlyrelease/insur202111.pdf
- National Center for Health Statistics. Percentage of being uninsured at the time of interview for adults aged 18-64, United States, 2019 Q1, Jan-Mar—2021 Q3, Jul-Sep. National Health Interview Survey. Generated interactively: Jan 22 2022 from https://wwwn.cdc.gov/NHISDataQueryTool/ER_Quarterly/index_quarterly.html
- Elizabeth Hinton and Lina Stolyar. Medicaid Authorities and Options to Address Social Determinants of Health (SDOH). KFF. Published August 5, 2021. https://www.kff.org/medicaid/issue-brief/medicaid-authorities-and-options-to-address-social-determinants-of-health-sdoh/
- Trends in the U.S. uninsured population, 2010-2020. ASPE. Updated February 11,2021.